Visualizing 311 Calls
Chicago and its Economic FabricFall 2022
Introduction to Geovisualization
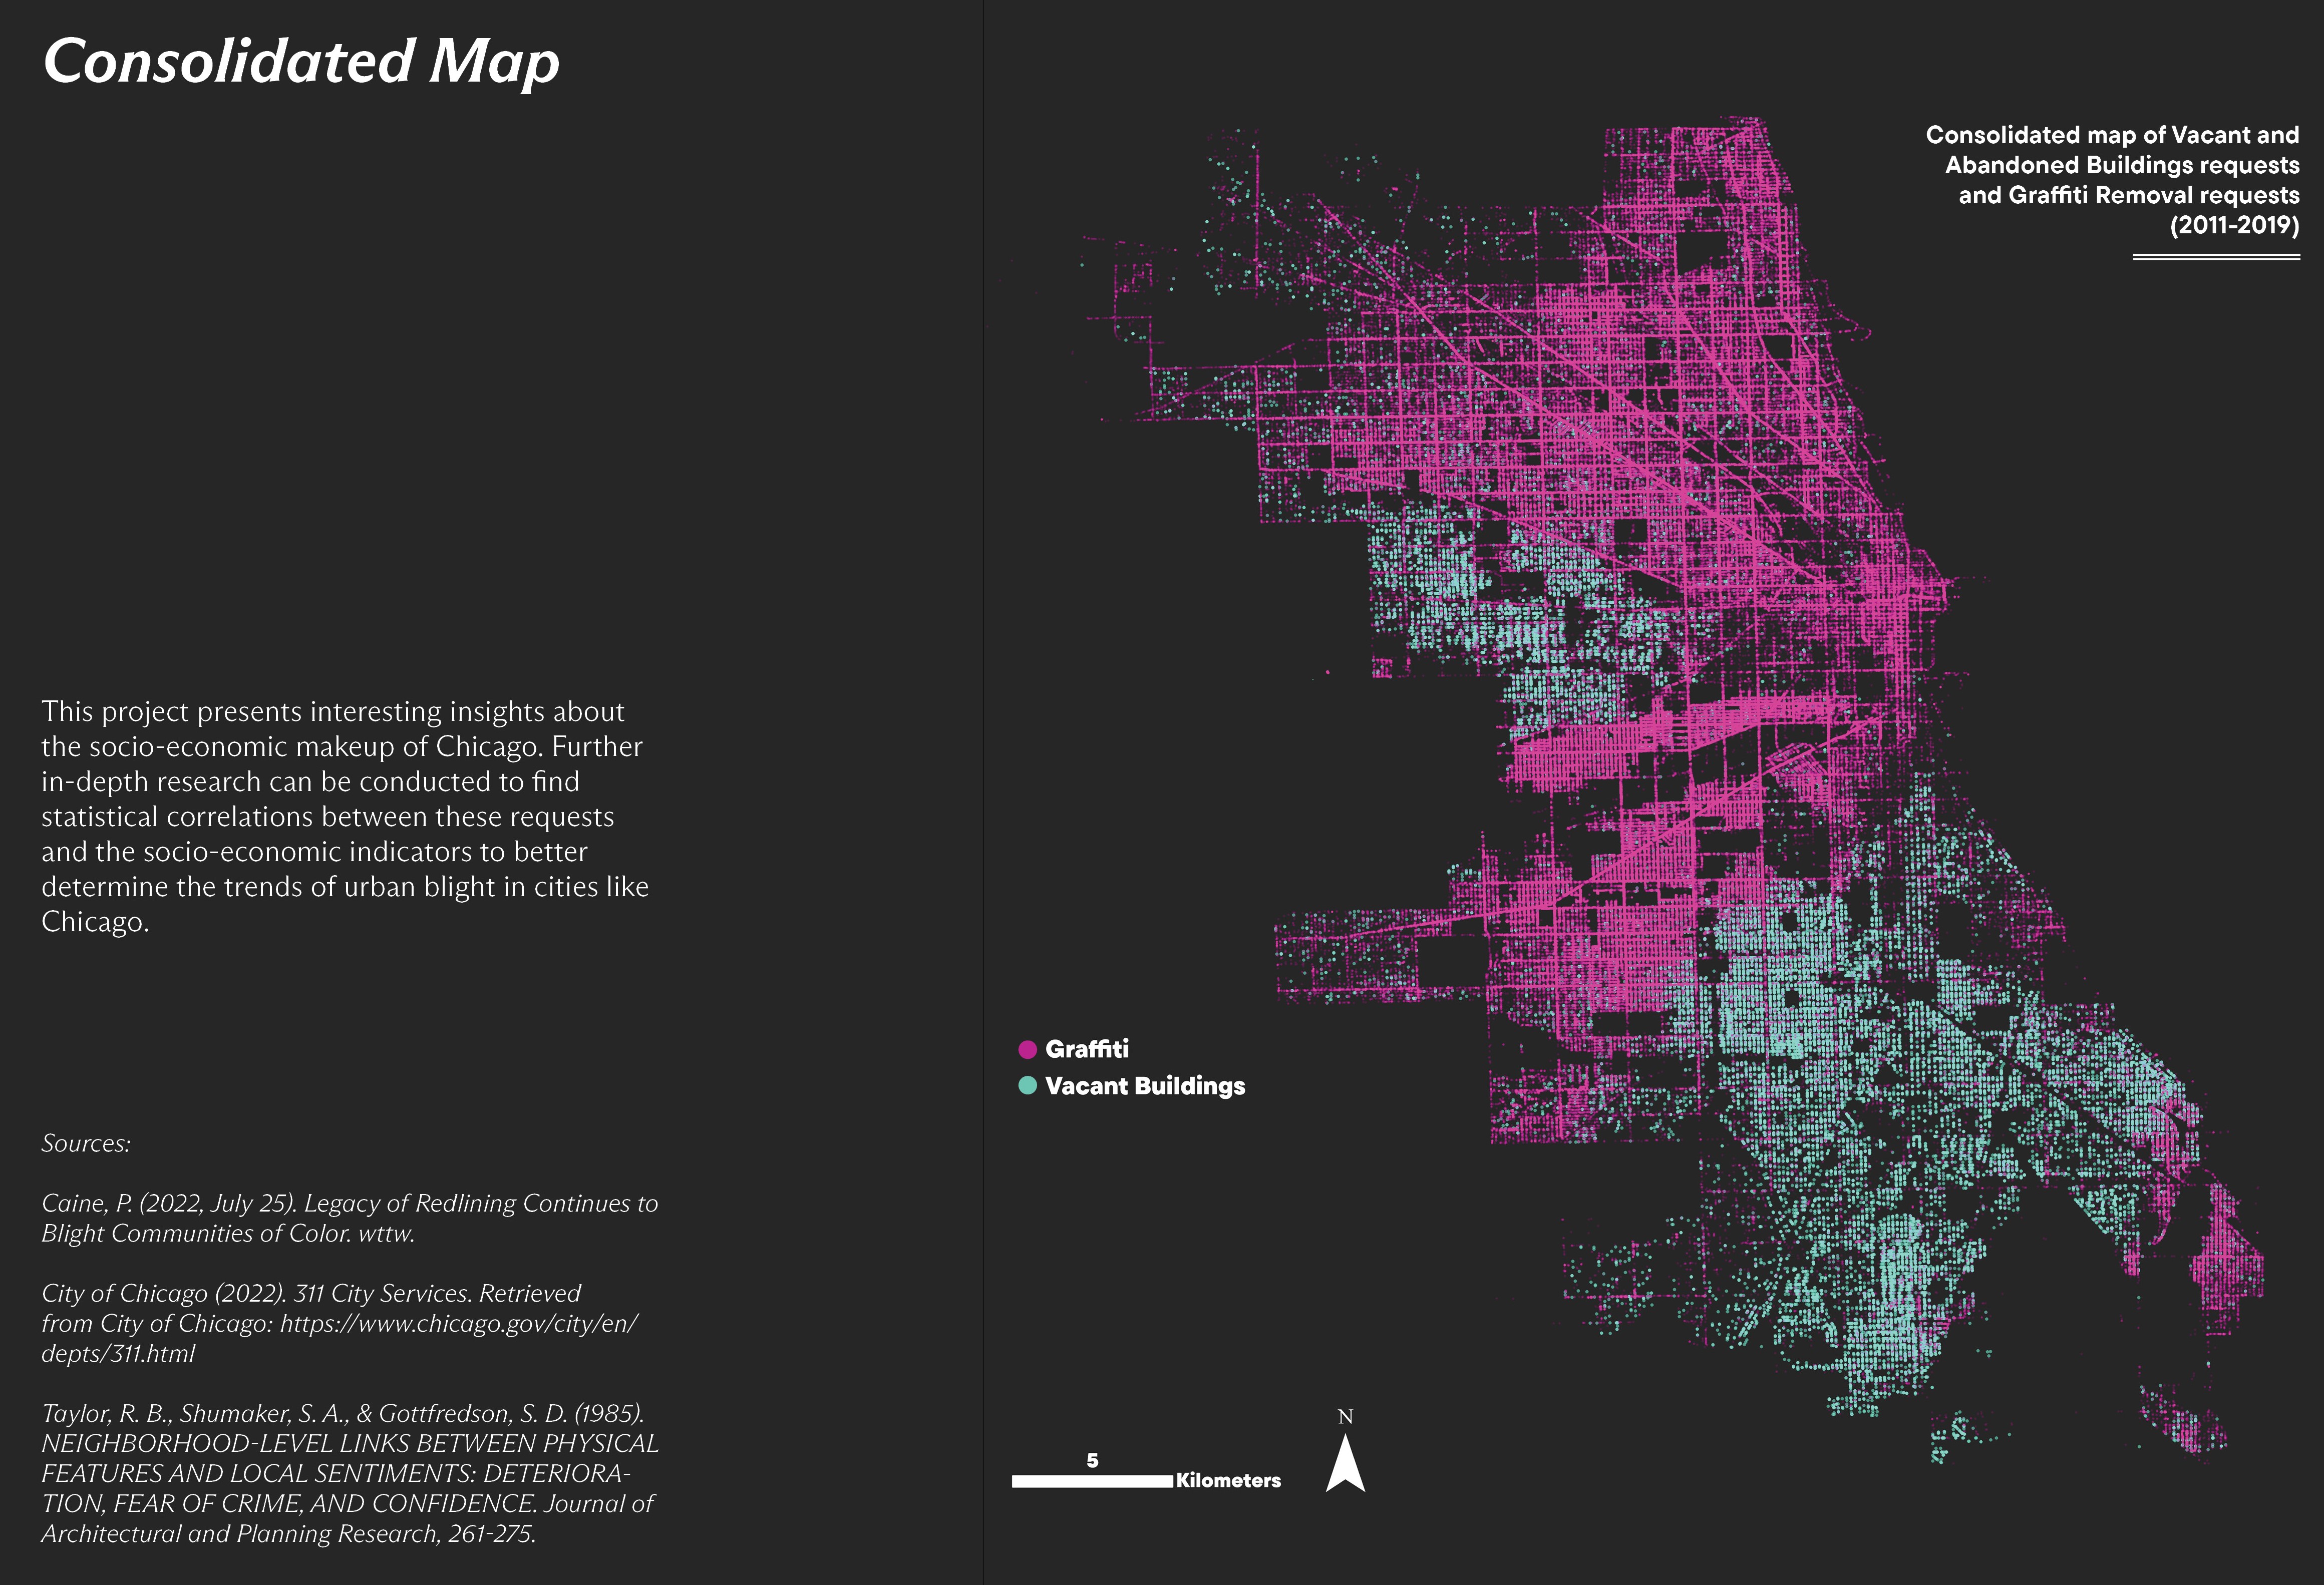
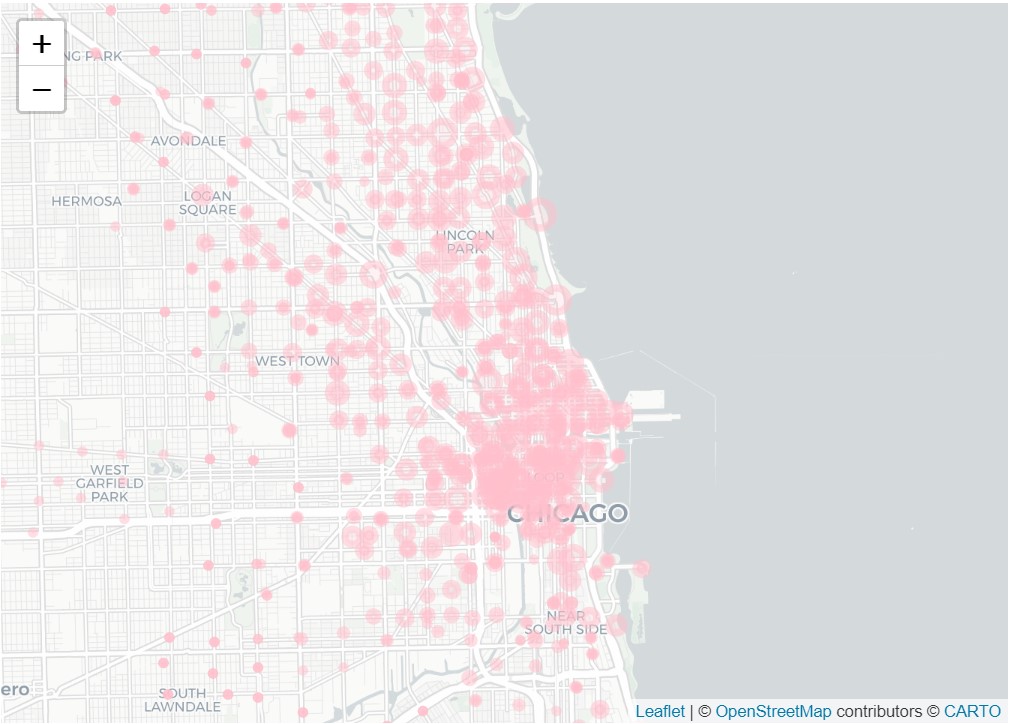
This project is an attempt to geovisualize the historical 311 calls data of Chicago against the percentage of households in each census tract in the city that earns less than $25,000 annually as per the 2019 ACS Data.
︎︎︎ Read more
R,
GIS,
Research
GIS,
Research
Exploring Divvy Bike Data
Fall 2022
Data Science and Predictive Analysis
I have attempted to analyze the Divvy Bike Trips Data, look for trends and patterns in ridership and predict whether trip duration is dependent on user type, weather conditions, user gender and weekday through multiple linear regression.
︎︎︎ Read more
R
Mapping New York’s Land Use
Summer 2022
Personal Project
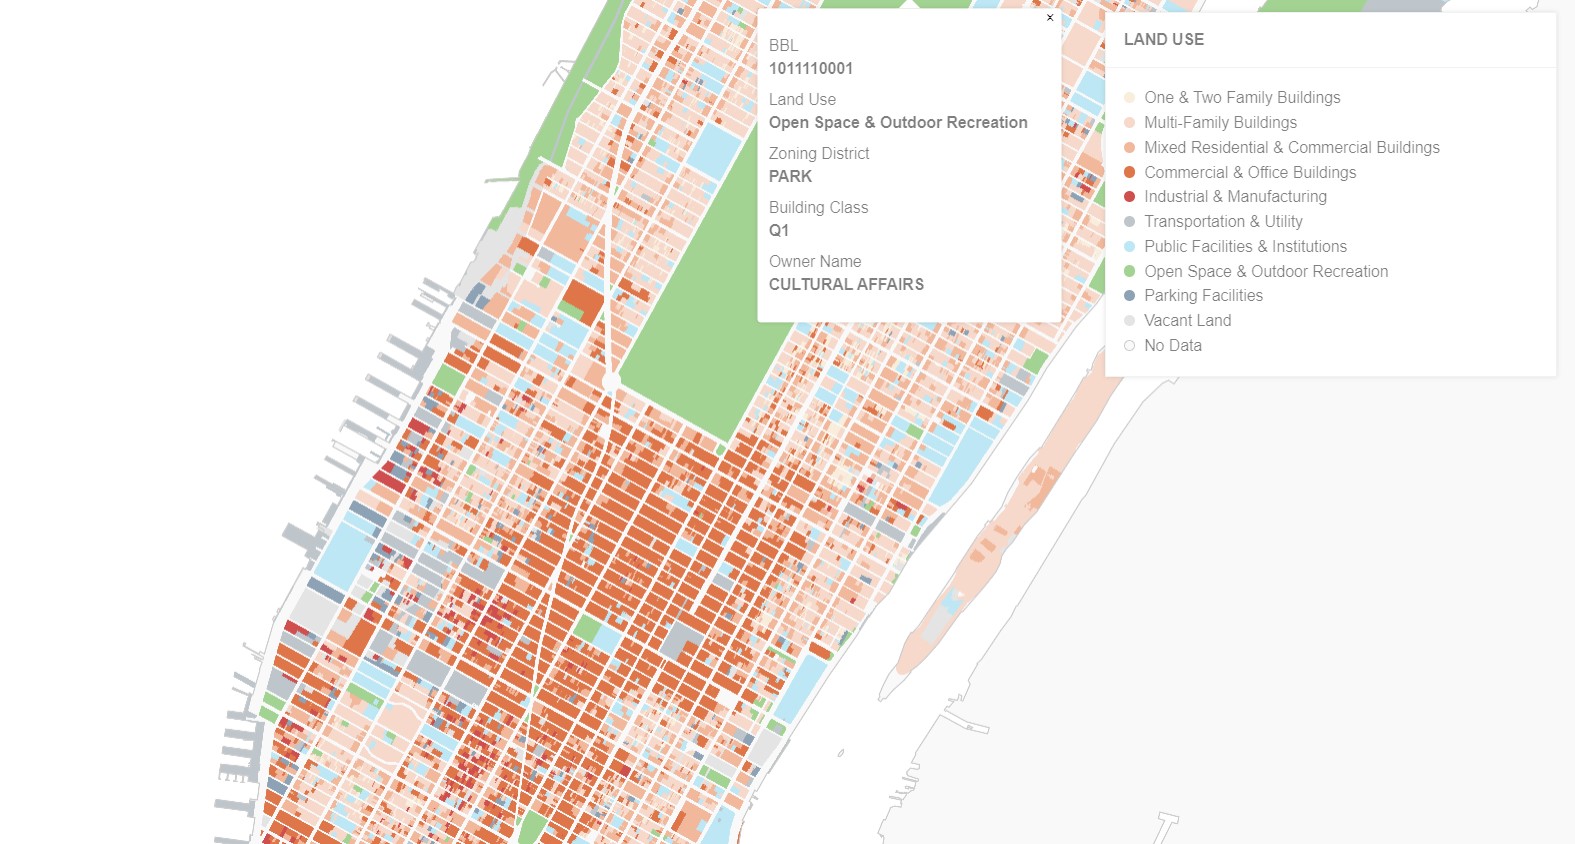
This is a personal project I created as a product of Morphocode’s Mapping Urban Data course.
Personal Project
This is a personal project I created as a product of Morphocode’s Mapping Urban Data course.
︎︎︎ Read more
GIS,
Mapbox GL JS,
HTML
Mapbox GL JS,
HTML
California Housing Prices
R Shiny AppFall 2022
Advanced Geovisualization
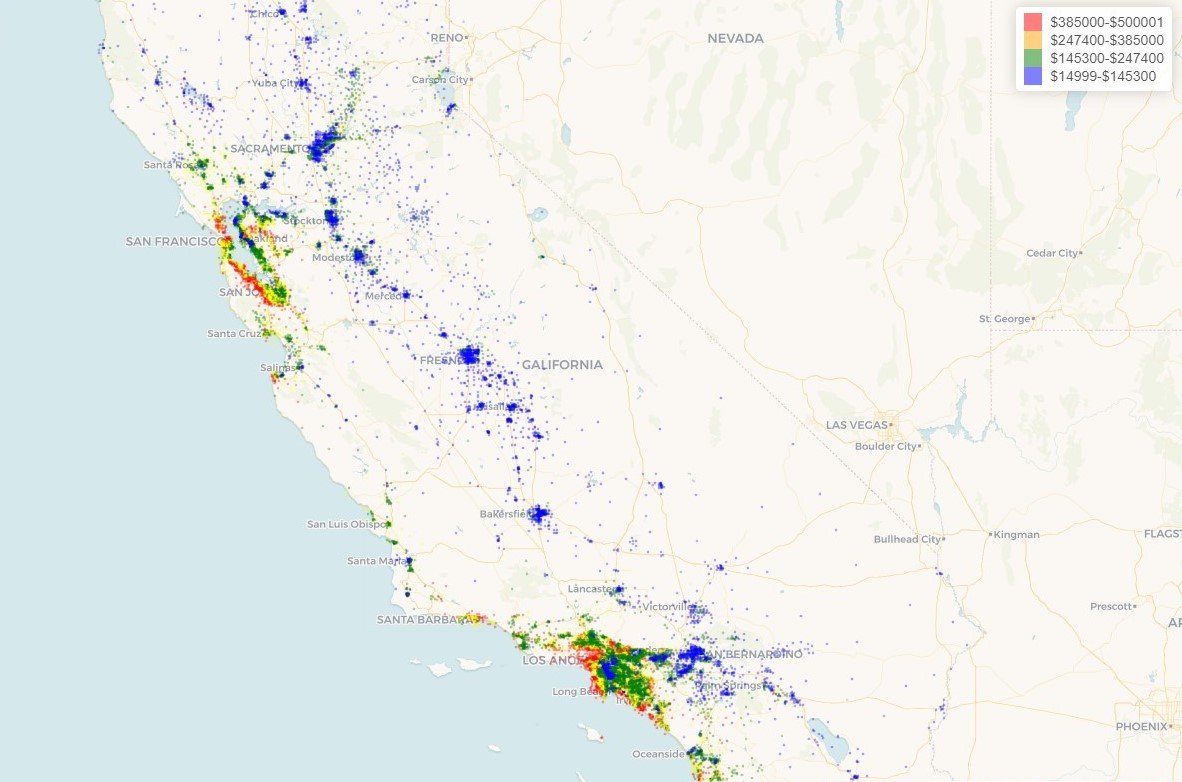
Increasing housing prices in the United States and especially in California is an ongoing socio-economic issue in the country. California's housing prices have remained the highest than the rest of the country since the 1970s. This shiny app displays the median housing prices in California for the year 1990.
︎︎︎ Read more
R
Sentiment Analysis of Song Lyrics
Foster the PeopleFall 2022
Advanced Geovisualization
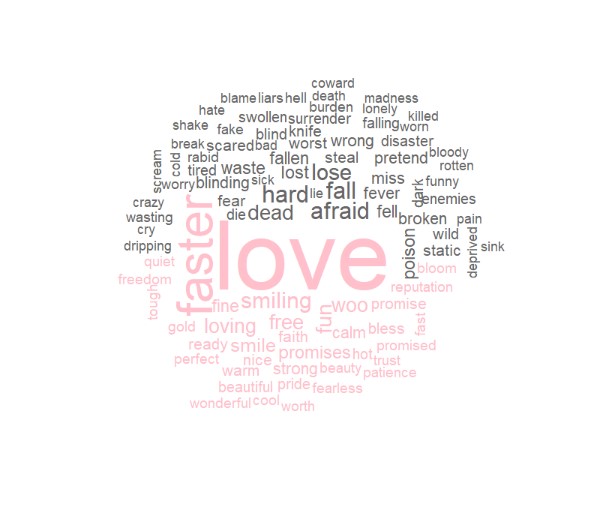
This project is a sentiment analysis of the songs of the indie pop band, Foster The People.
︎︎︎ Read more
R
Planning for Mitigating the Risk of Human-Wildlife Conflict in Urban Areas
2020
Undergraduate Thesis
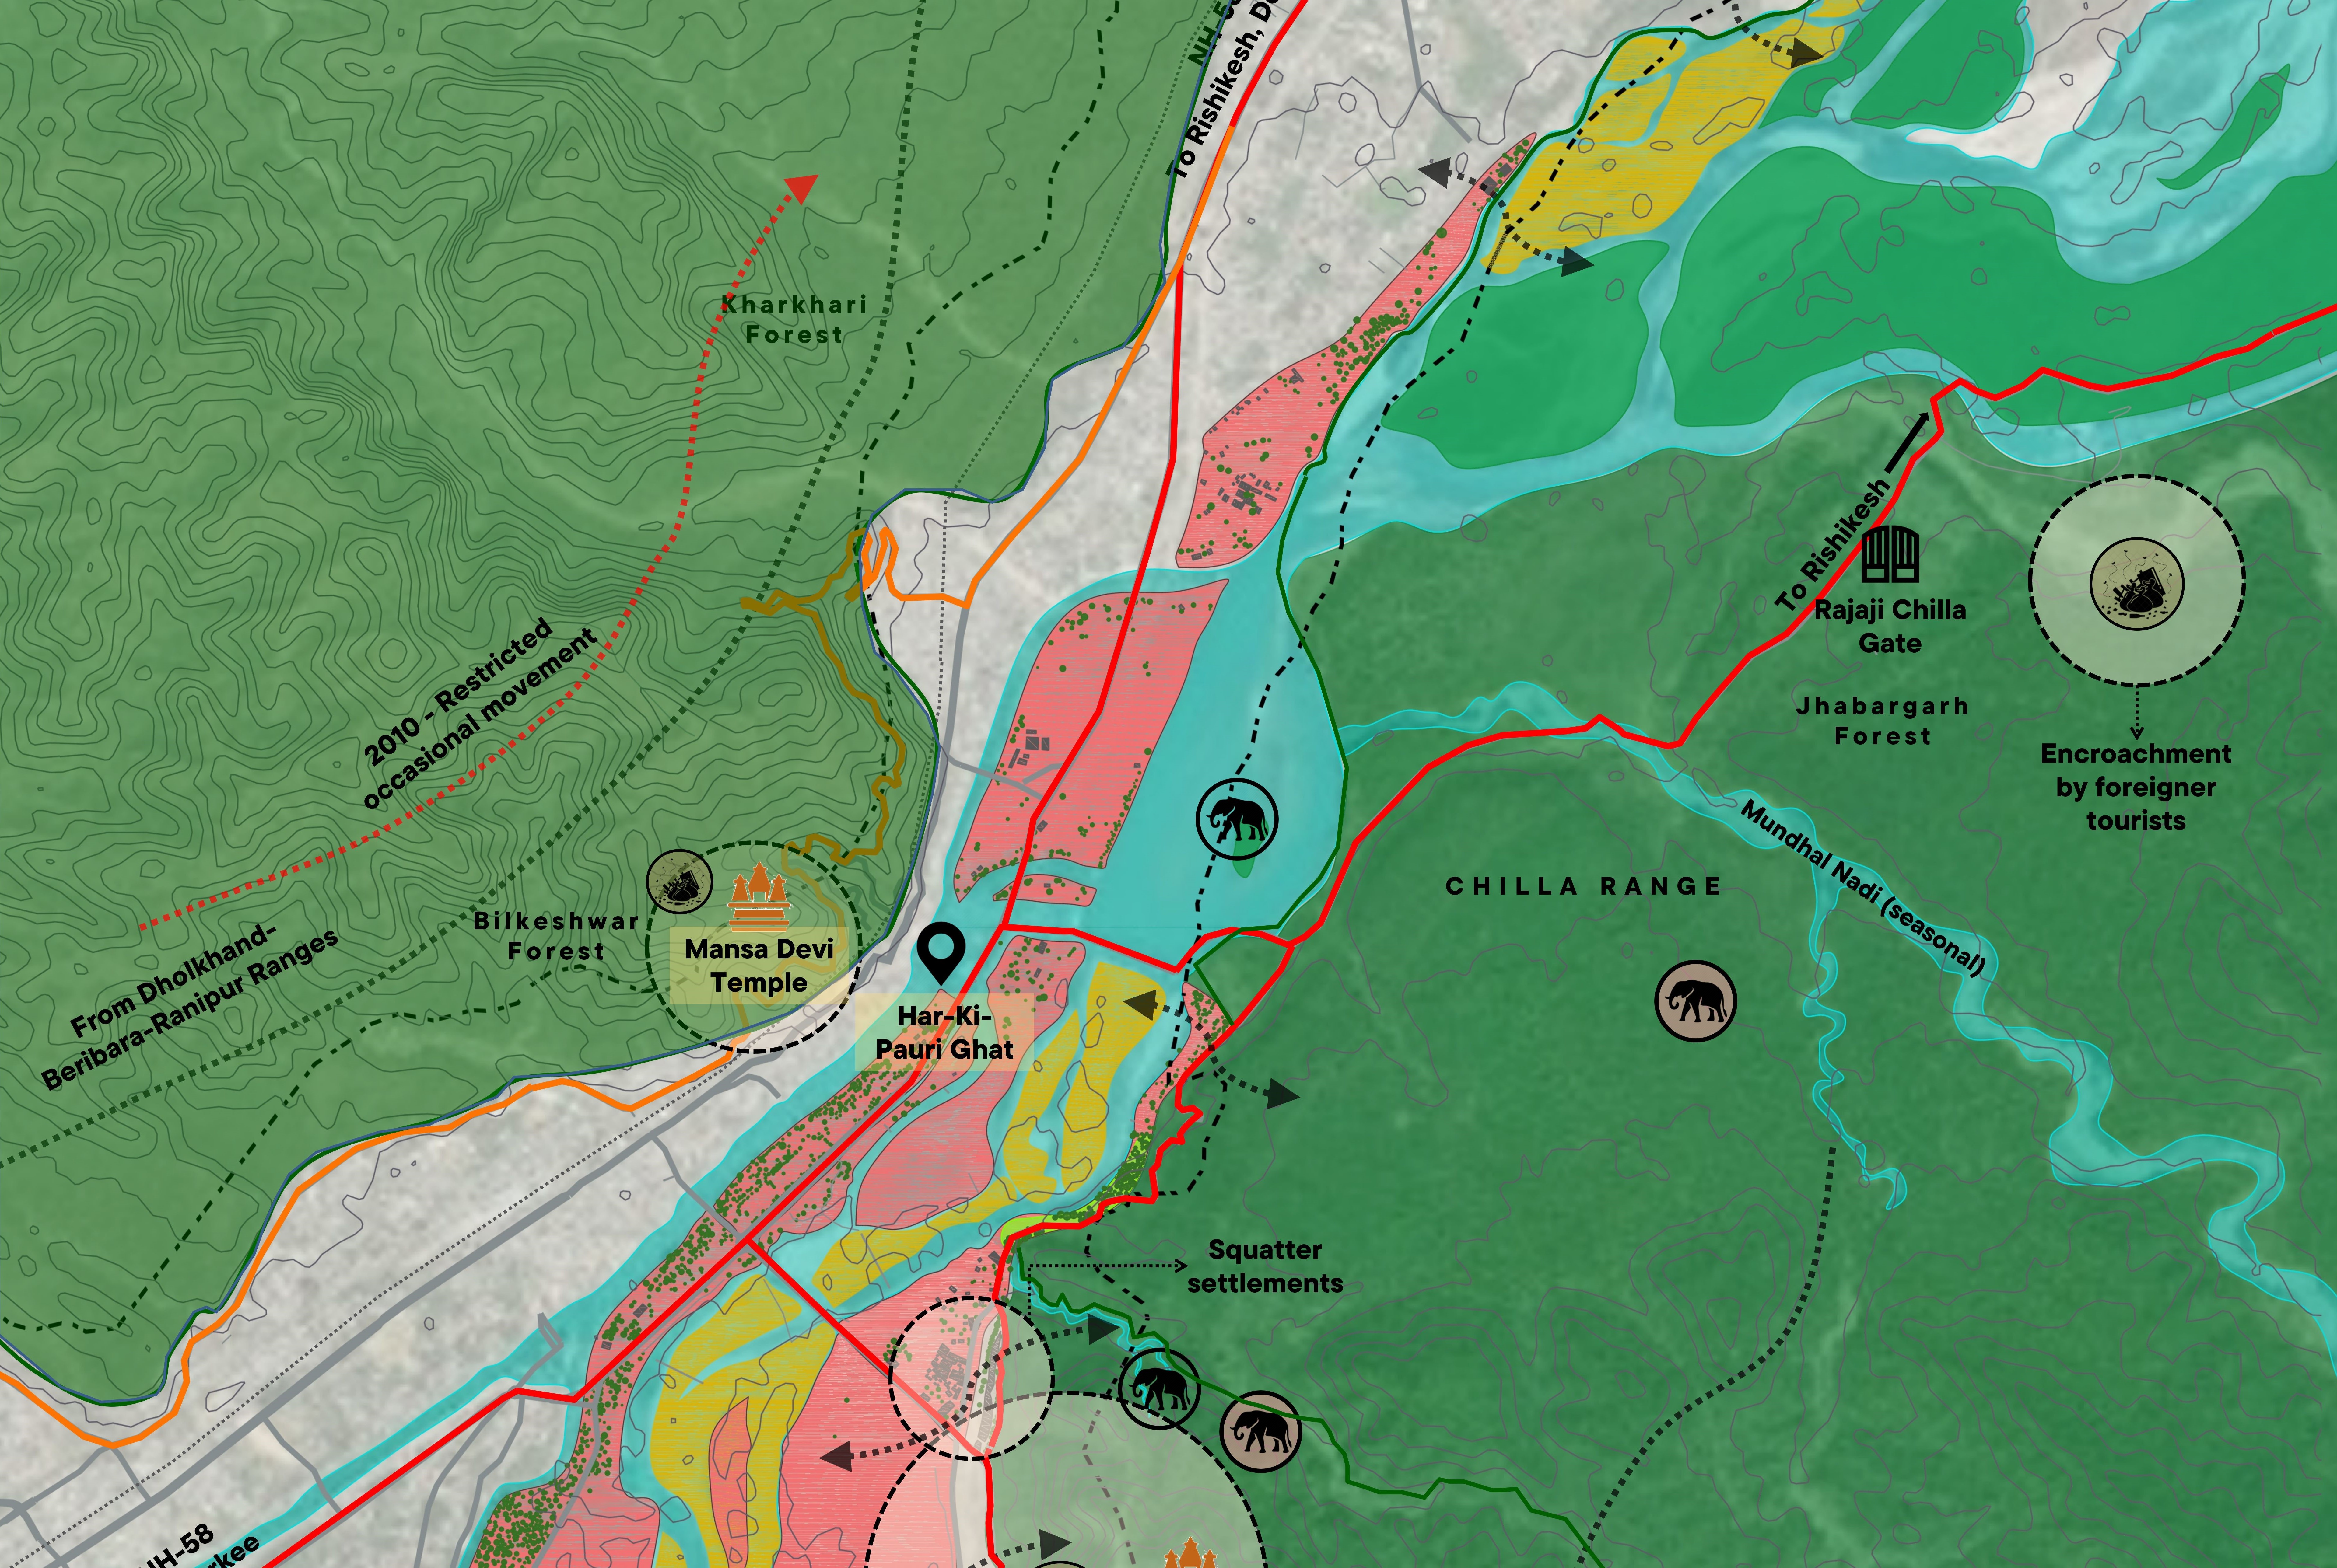
This study aimed at identifying the drivers and impacts of human-wildlife conflicts in Haridwar, a city cutting through the Rajaji National Park, a crucial protected area in the lower Himalayas.
︎︎︎ Read more
Research,
Writing,
AutoCAD,
GIS
Writing,
AutoCAD,
GIS
