Visualizing 311 Calls
Chicago and its Economic Fabric
Fall 2022
Introduction to Geovisualization
Course by Professor Derek Van Berkel
School of Environment and Sustainability
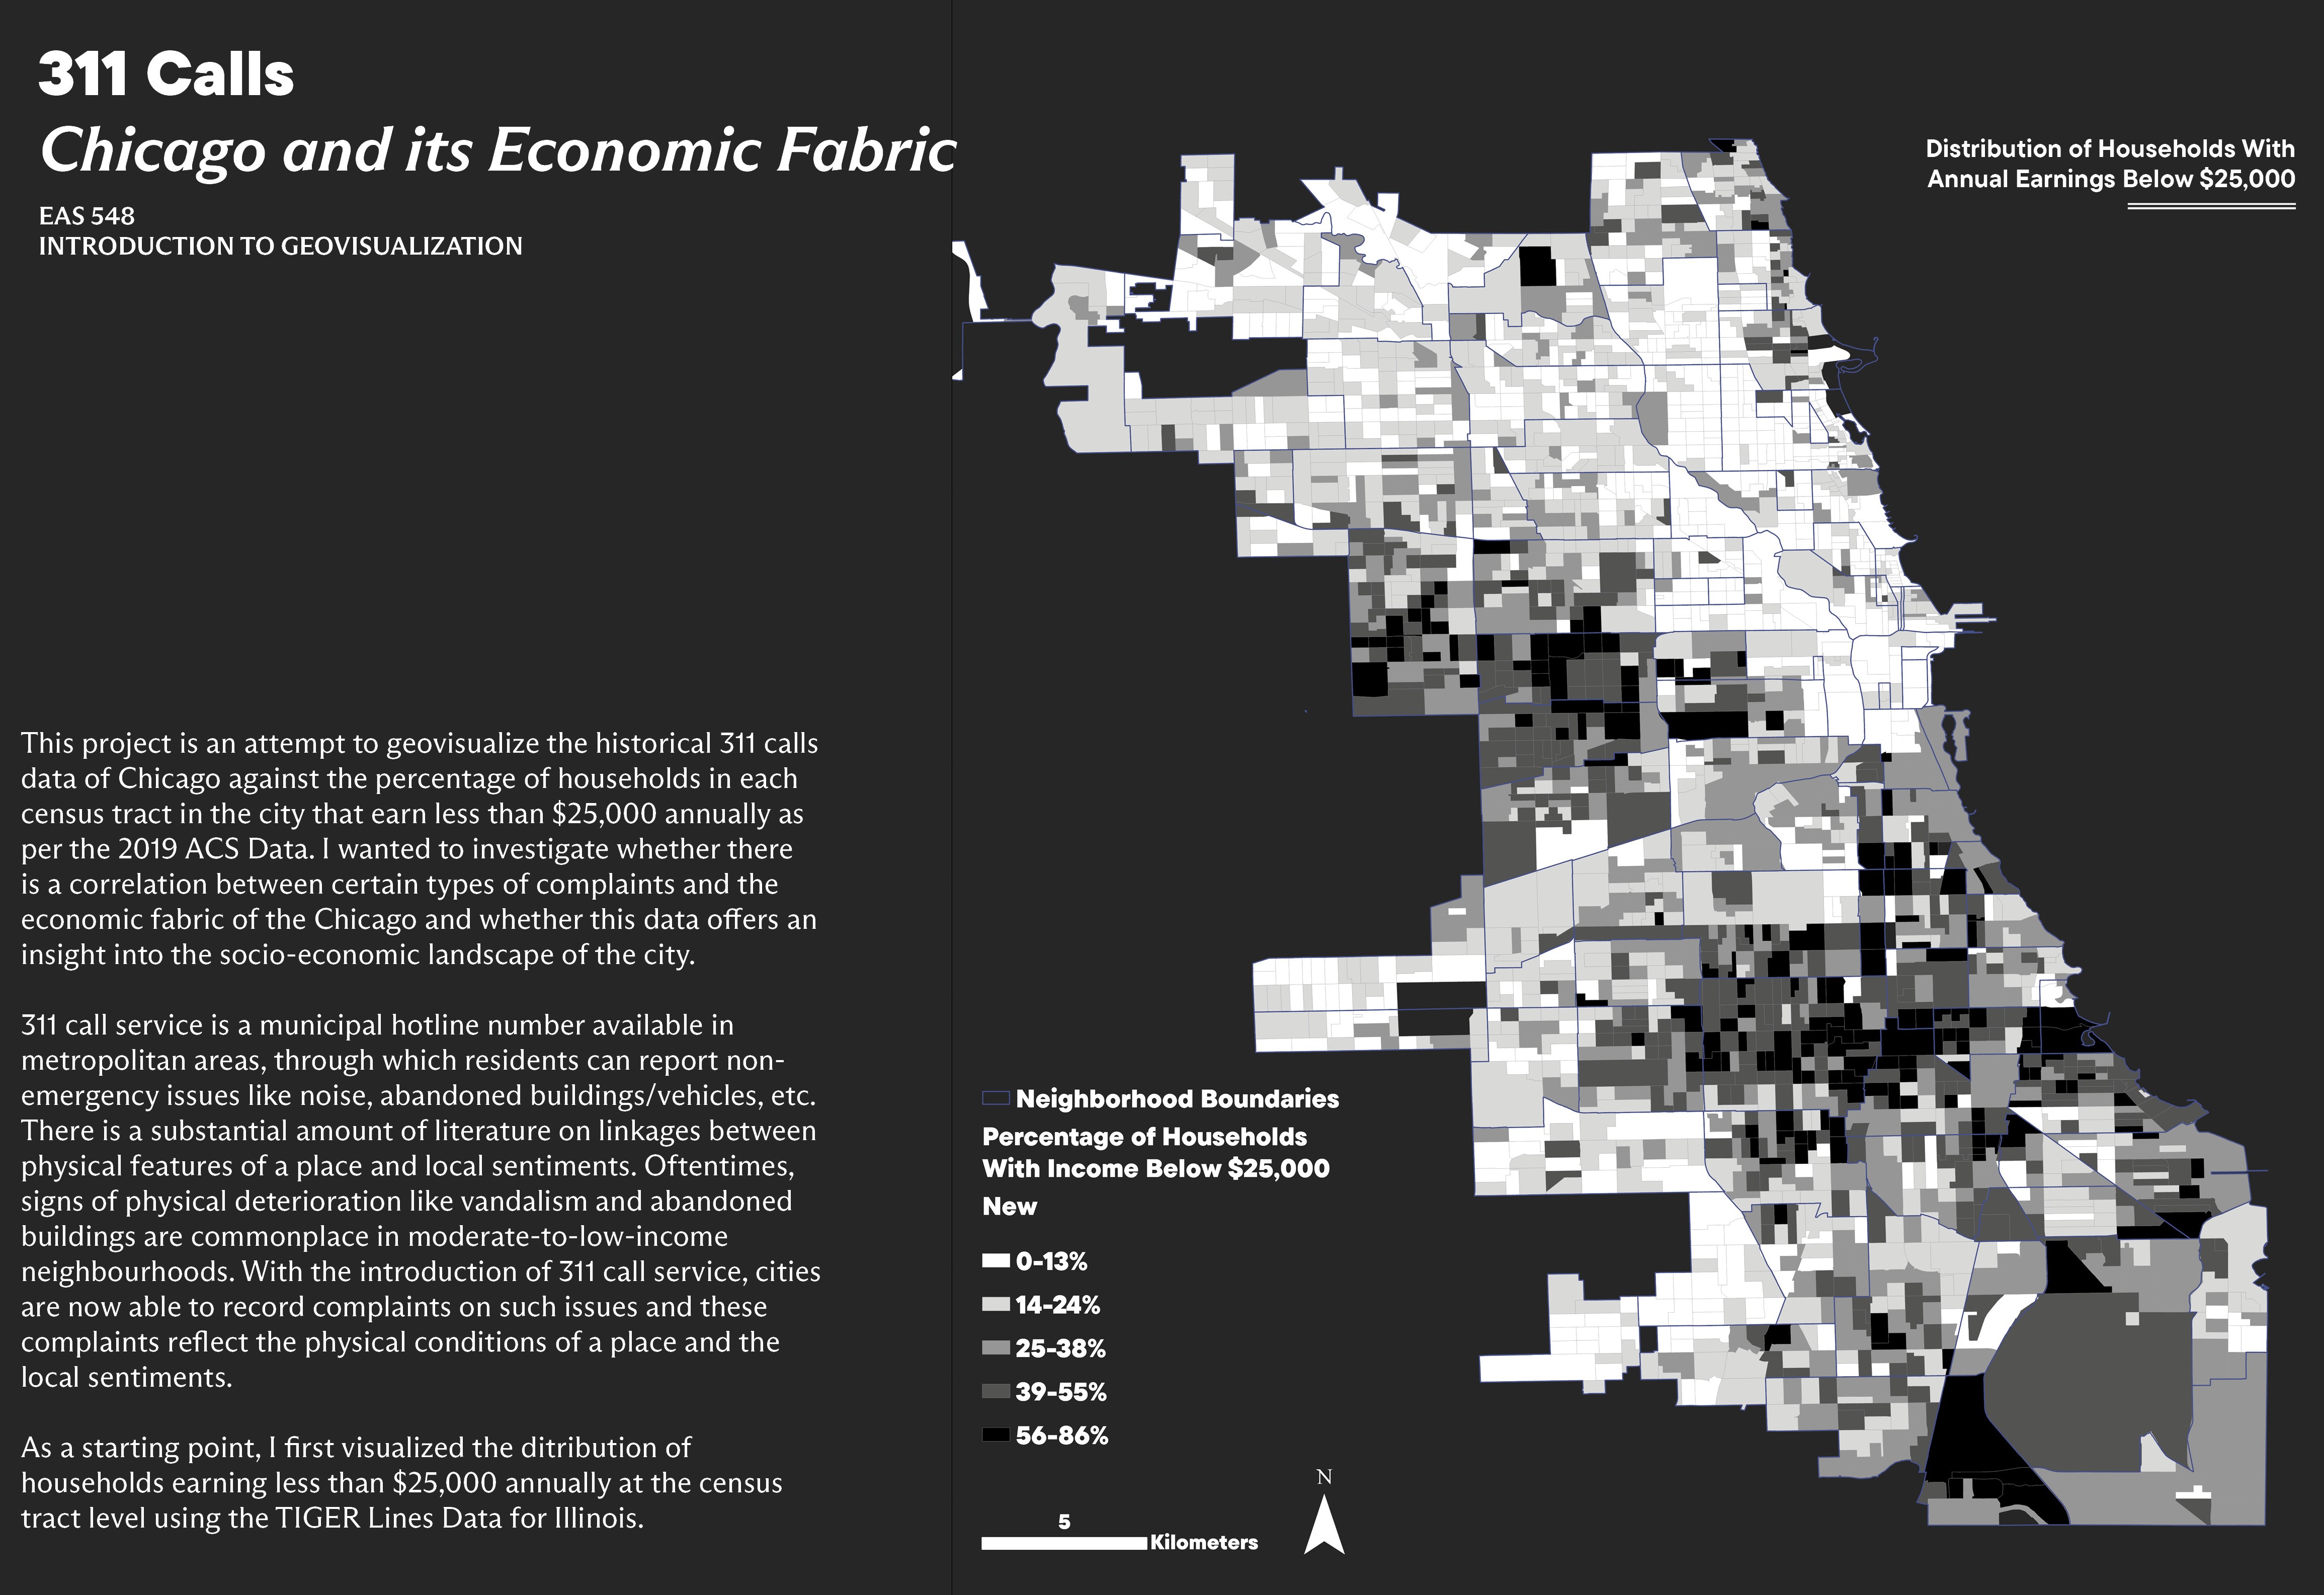
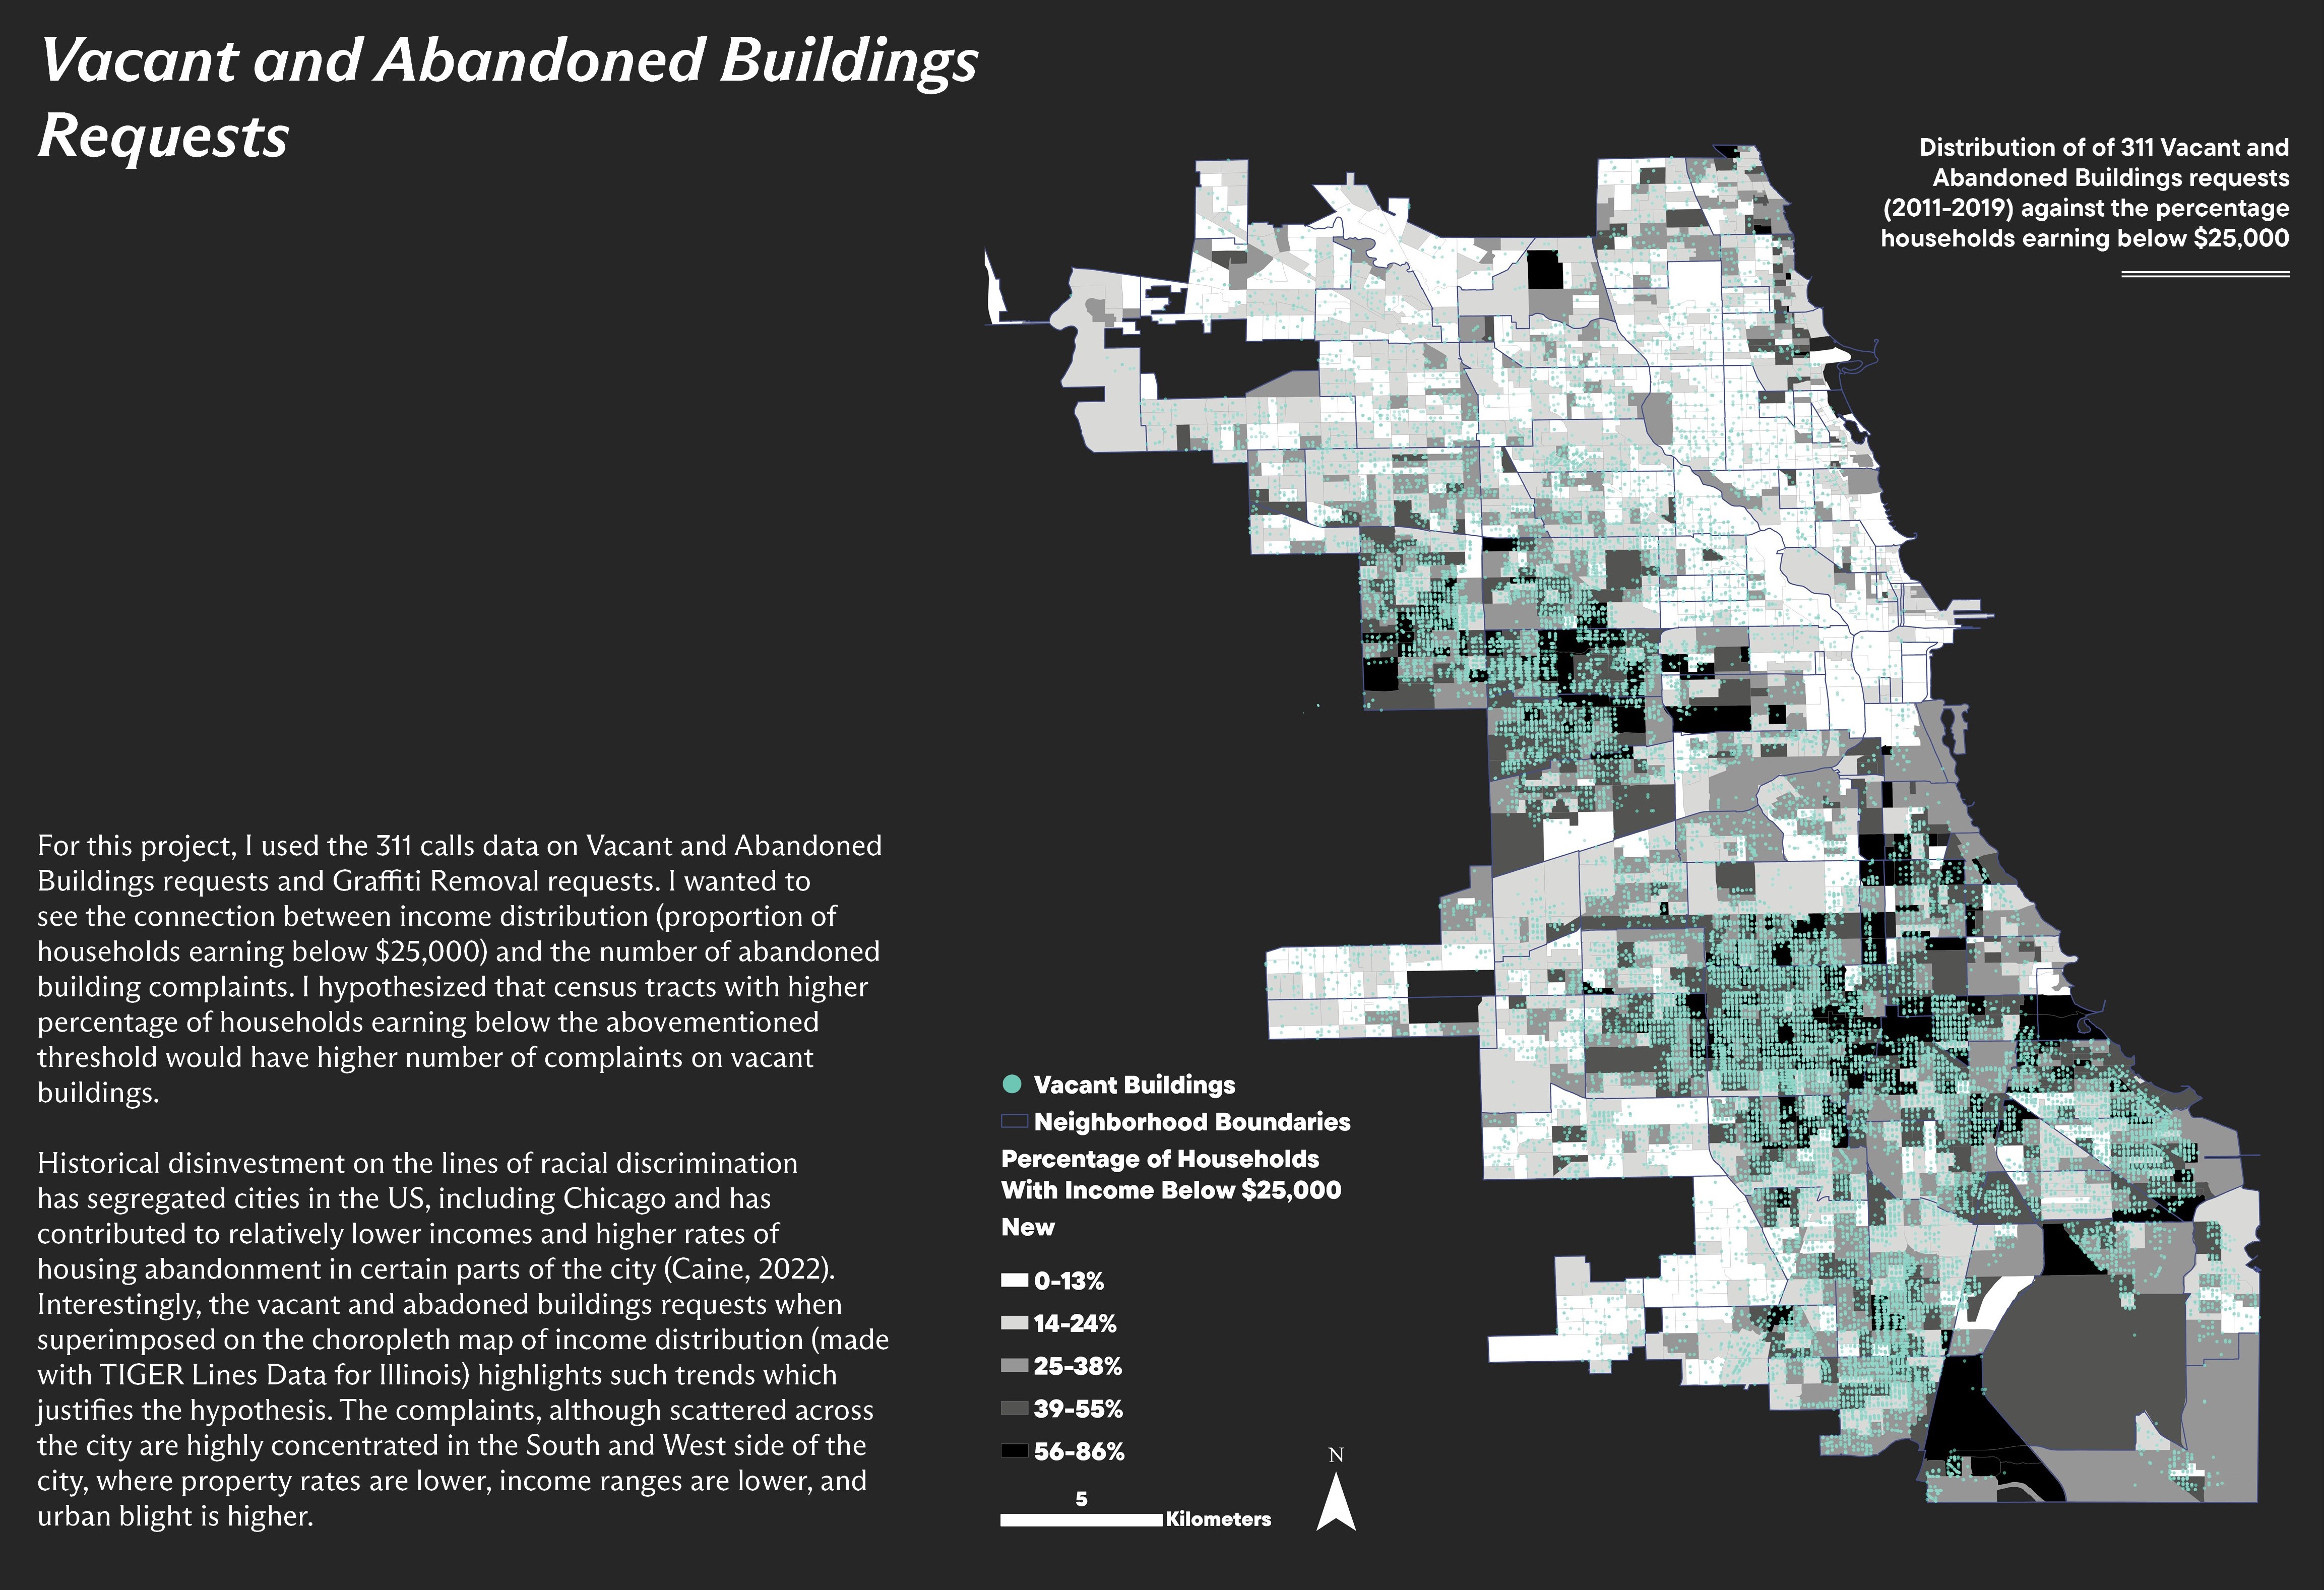
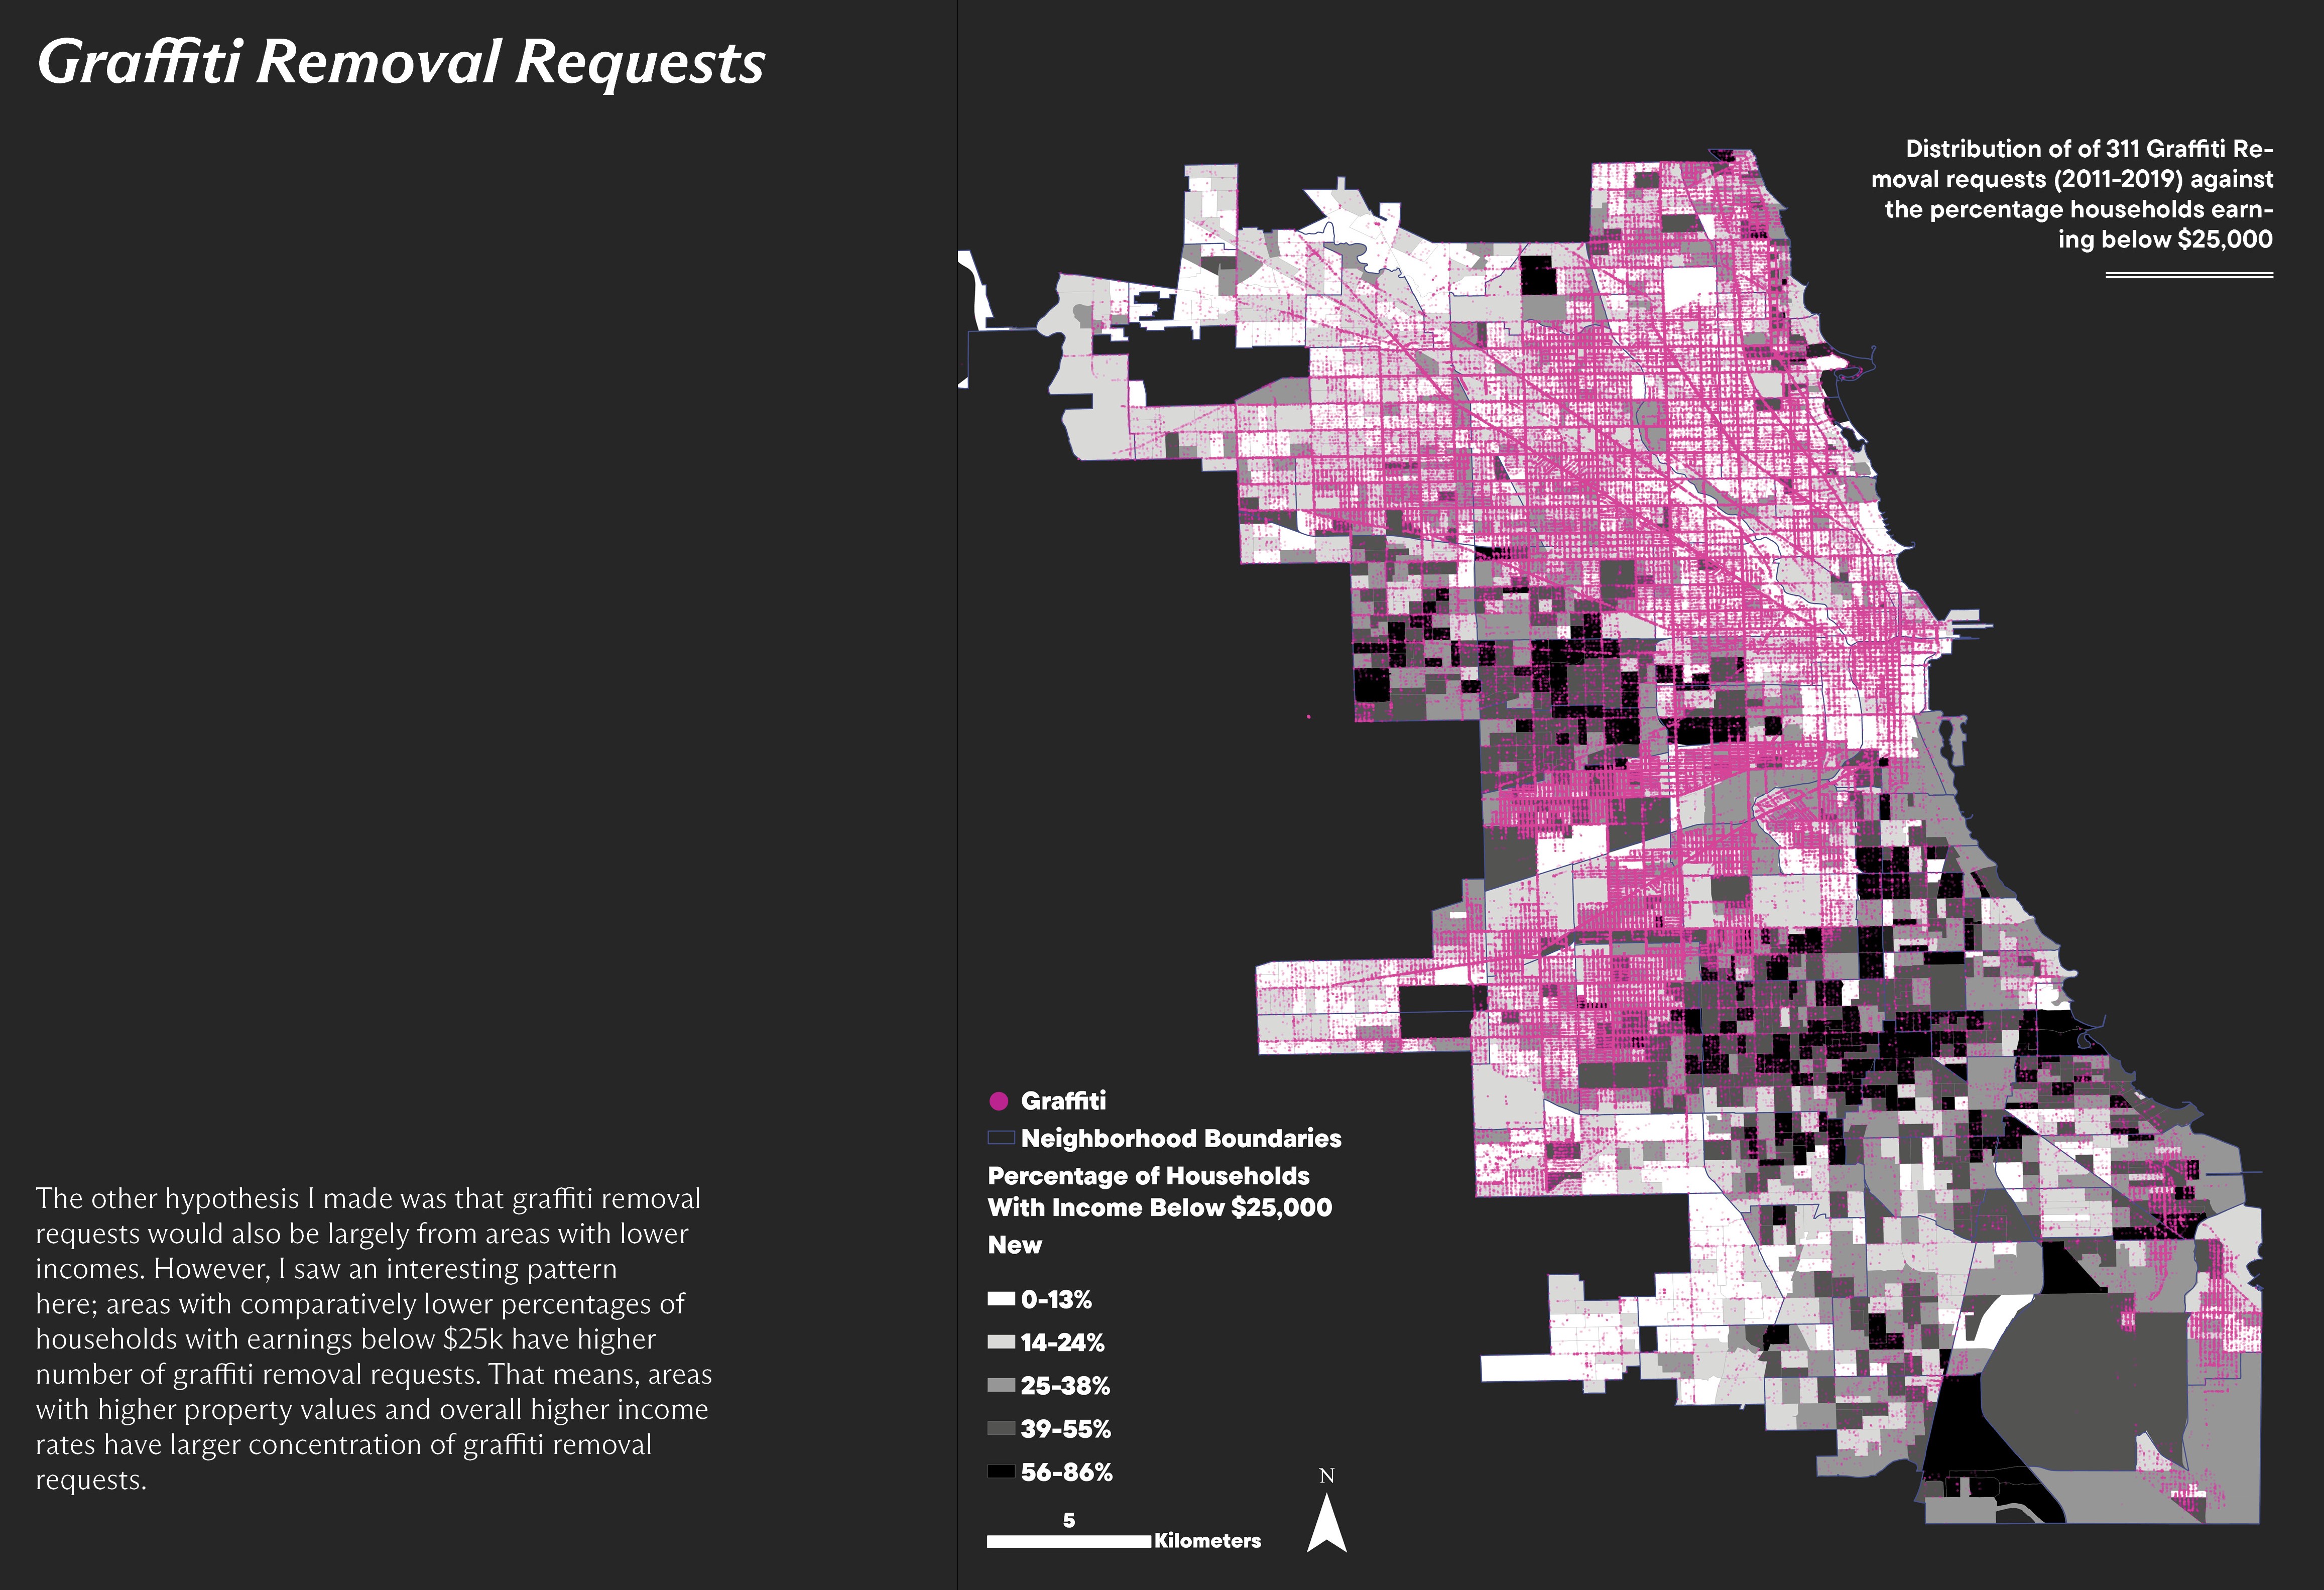
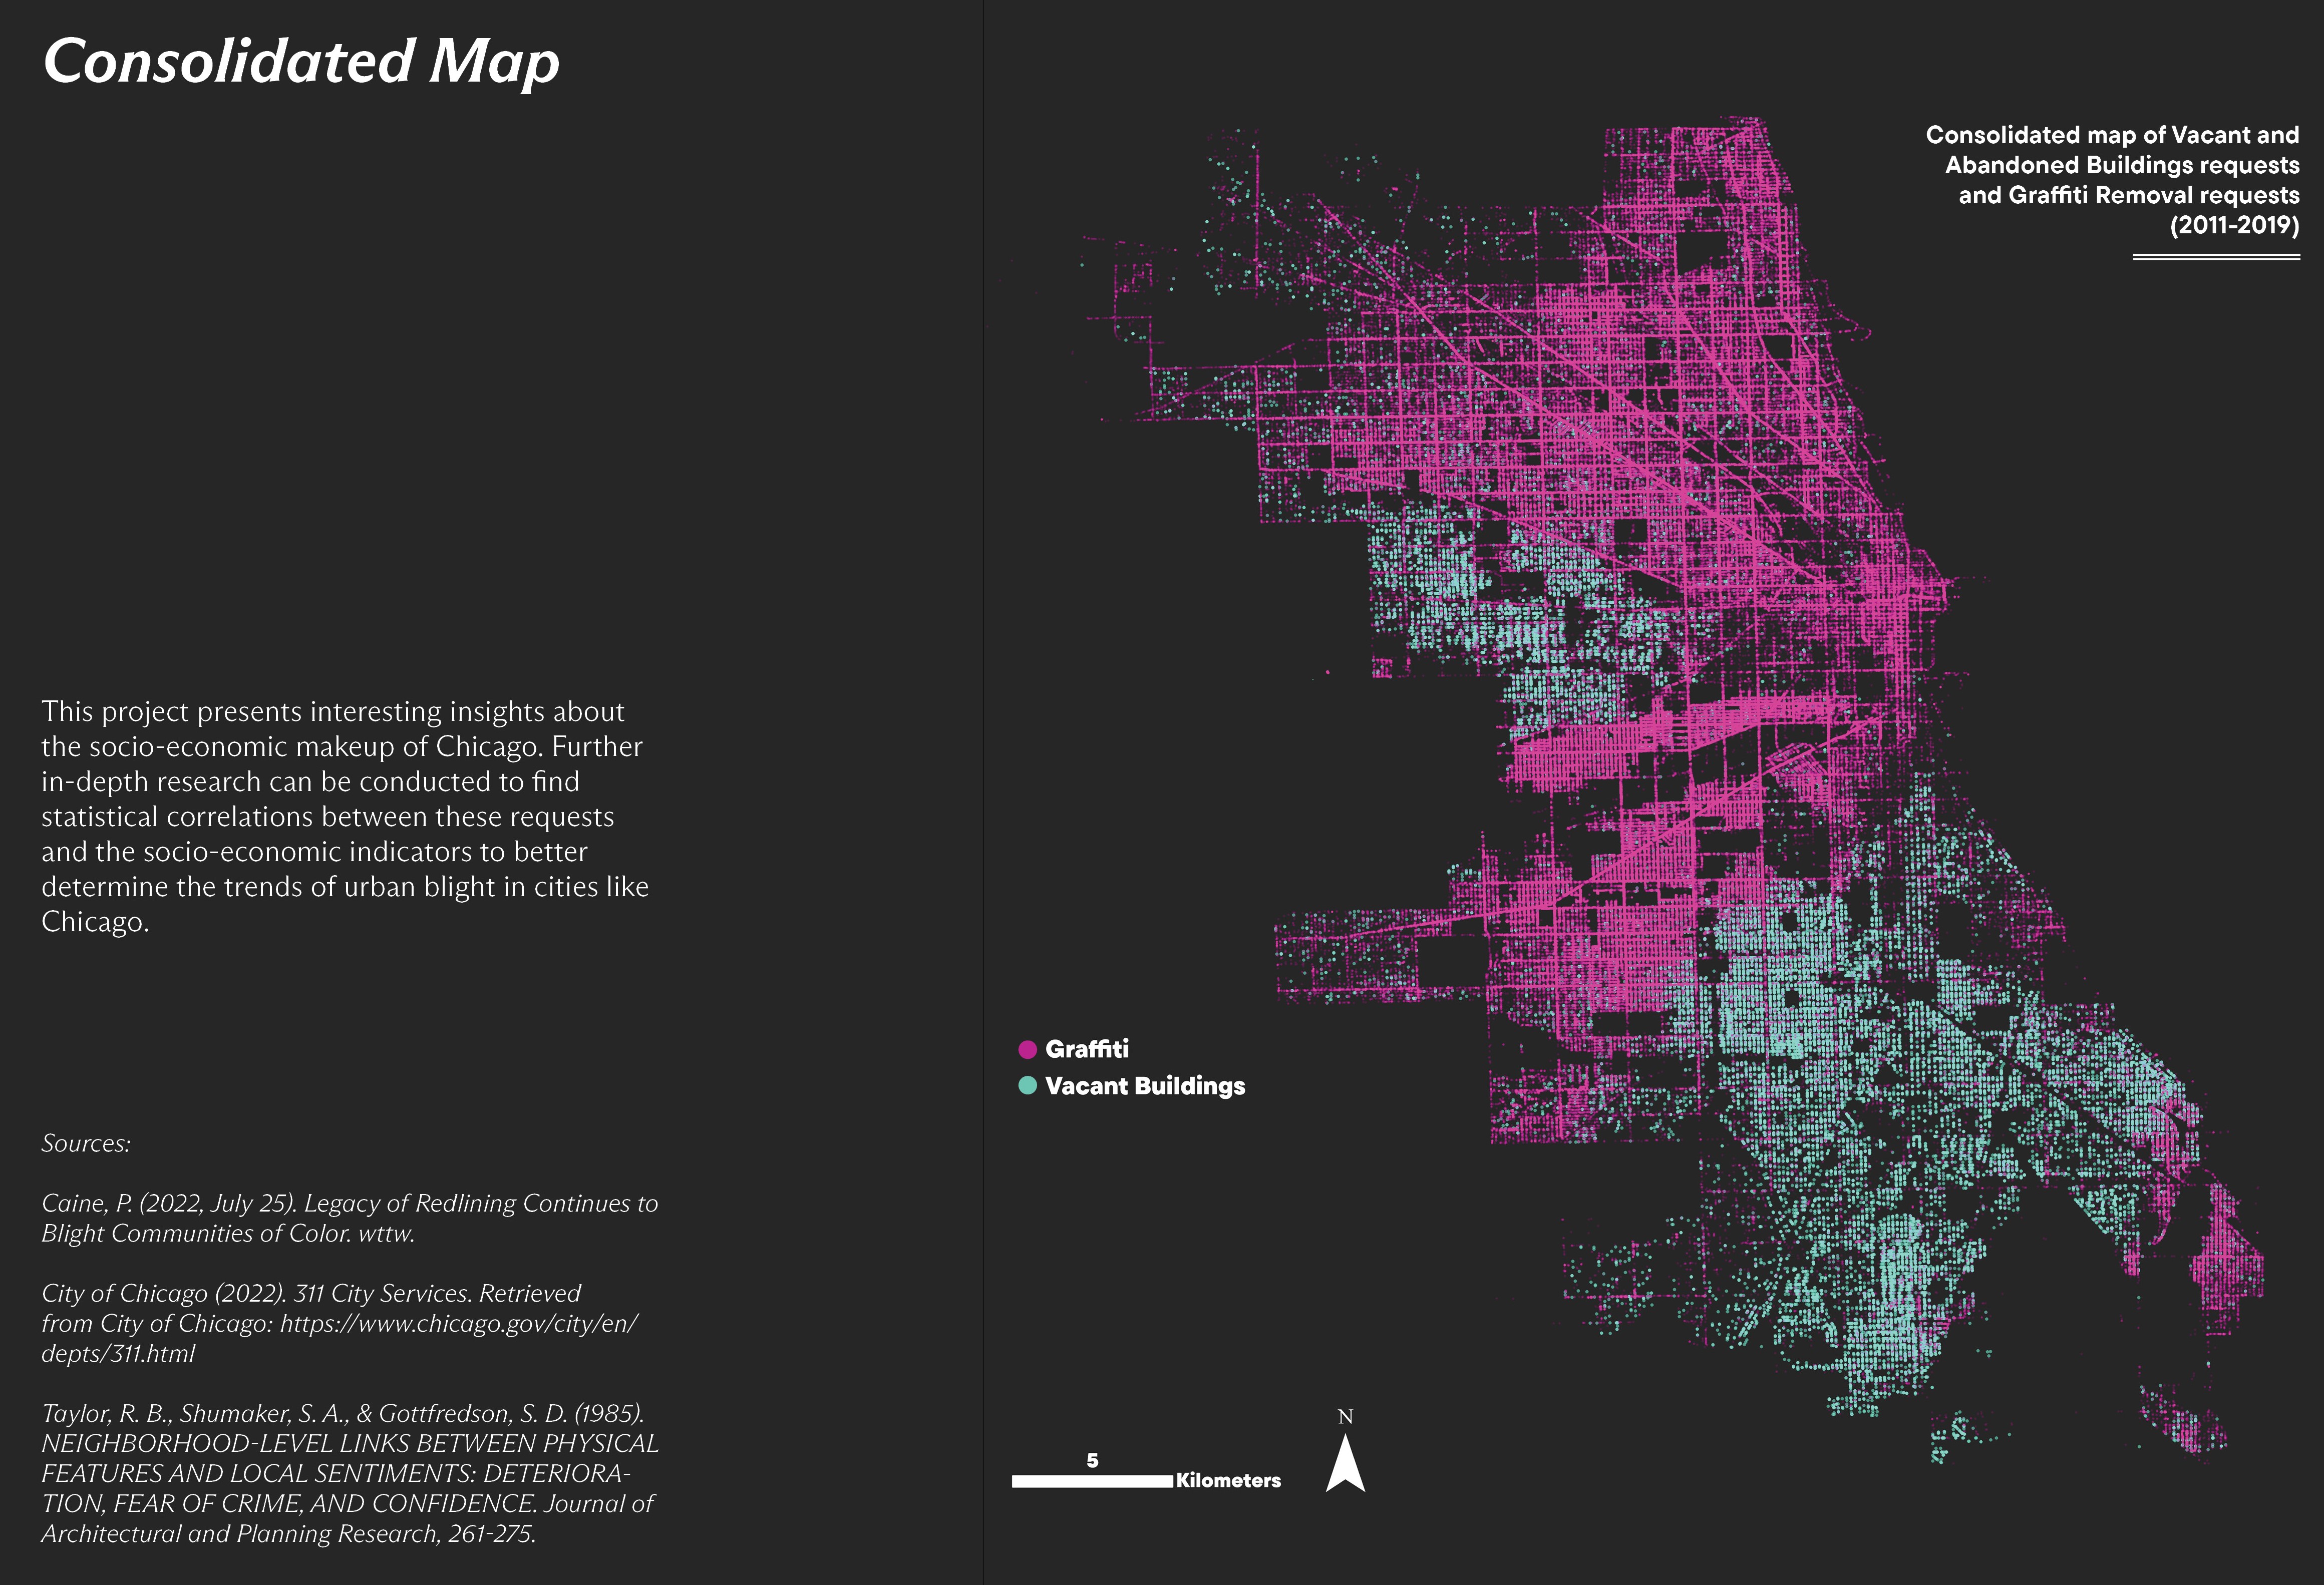
This project is an attempt to geovisualize the historical 311 calls data of Chicago against the percentage of households in each census tract in the city that earns less than $25,000 annually as per the 2019 ACS Data. To investigate whether there is a correlation between certain types of complaints and the economic fabric of the Chicago, TIGER Lines Data for the state of Illinois is visualized on the census tract level and is juxtaposed with the historic 311 calls data for graffiti removal requests and vacant and abandoned building requests.
The maps below help to gain insights into where census tracts with the earning below $25,000 are located, where the calls are coming from and eventually the relationship between socio-economic landscape of the city and the issues related with specific areas of the city.
The maps below help to gain insights into where census tracts with the earning below $25,000 are located, where the calls are coming from and eventually the relationship between socio-economic landscape of the city and the issues related with specific areas of the city.


